Tool - R programming, Gephi
Technique - Market basket analysis
Dataset - Dunnhumby - Transactions performed by 2,500 households who were frequent shoppers at a retailer over two years.
Problem statement
Determine the customer purchasing behaviour and improve their shopping experience.
Market basket analysis
First, FP-Growth algorithm is performed. The FP-Growth algorithm is an association analysis algorithm that discovers the frequent itemset without the candidate generation (Kavitha & Tamil, 2016). The input data of the algorithm is the transactional dataset and a minimum support threshold value.The minimum support level is set to 1% and it identified 2,783 frequent itemsets. Each set contained one to five different types of products.
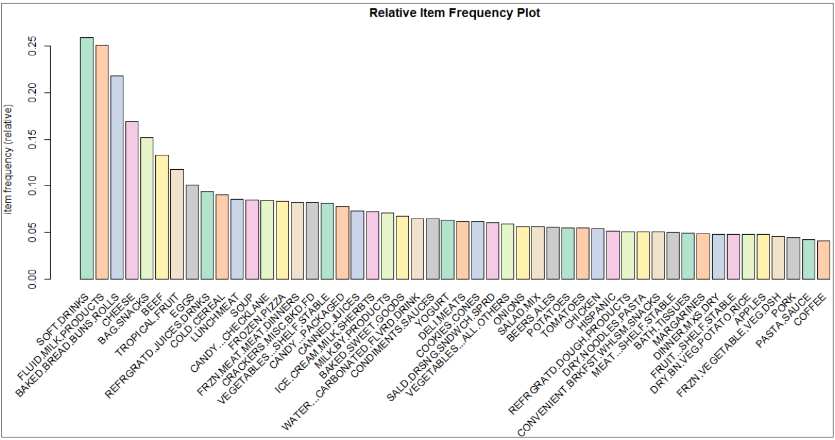
Figure below shows a item frequency plot of top 50 items with the highest support:
The SOFT.DRINKS has the highest support level of 25.9%, followed by FLUID.MILK.PRODUCTS (25.0%) and BAKED.BREAD.BUNS.ROLLS (21.8%). Both soft drinks and FLUID.MILK.PRODUCTS appeared about one quarter of the total transactions recorded in the first dataset.
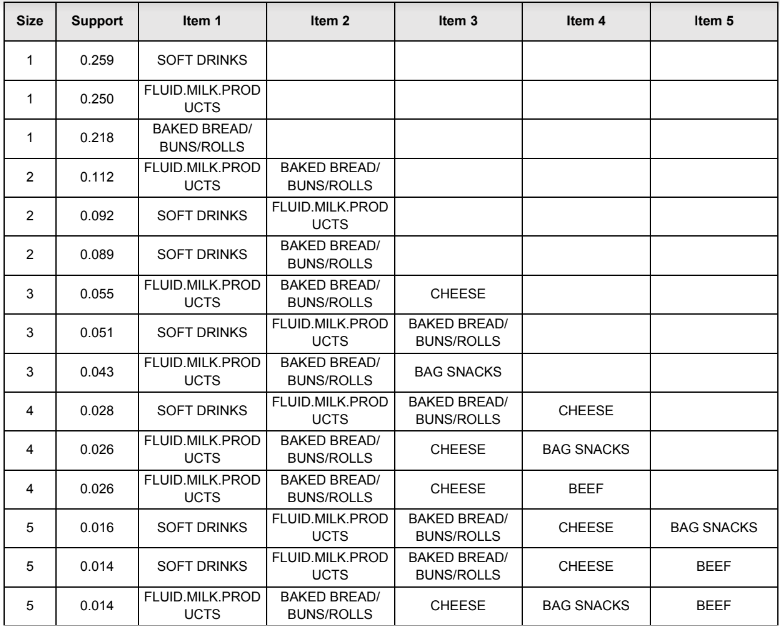
The table below displays the top 3 highest support for 1-, 2-, 3-, 4- and 5-itemsets, sorted by support in descending order:
All items which appeared in their respective itemset are fast-moving consumer goods. Hence, they were the most frequently items bought by consumers.
Association rules were generated from the given frequent itemsets. There are 2,583 rules which surpassed the minimum confidence level of 50%. Two scatter plots with support on the x-axis but different y-axis were plotted, as shown below:
These plots illustrated the relationship between the three metrics, i.e. support, confidence and lift. Study conducted by Bayardo, Jr. and Agrawal (1999) concluded that the most interesting rules reside on the ‘support-confidence boundary’. The boundary is where rules fall on the right hand border of the plot, as seen in the left side of the plot. Apart from that, the plot on the right illustrates that rules with high lift value have low support. Notably, all rules have lift higher than 1. This may be attributable to the values we set for the minimum support and confidence level.
The table below lists the nine rules which formed the boundary:
All these rules have FLUID MILK PRODUCTS as their consequent, whereas their antecedent contained either BAKED BREAD BUN ROLLS,EGGS,COLD CEREAL, or CHEESE. COLD CEREAL appeared in antecedent for the first eight rule. These 8 rules have at least 70% confidence and minimum lift value of 2.67. In other words, we can infer that by placing fluid milk products near to cold cereal, customers are very likely to grab both products.
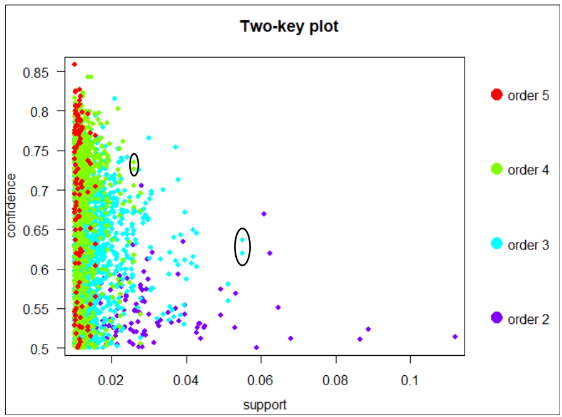
A two-key plot is used to illustrate the association rules as belows:
Colour of each point indicates the number of items included in the rule. Generally, higher order tends to have lower support. However, there are some high-order rules which have greater support than some low-order rules.Table belows summarises these rules:
FLUID MILK PRODUCTS and CHEESE appeared in antecedent when BAKED BREAD BUN ROLLS was the consequent. These rules have at least 63% confidence and minimum lift value of 2.84. Therefore, it is slightly certain that customers are probably to place these products in their shopping trolley, implies that hypermarket
From the item frequency plot, we know that SOFT DRINKS has the highest support. Therefore we would like to know what other products that customers bought together with soft drinks. By setting the rhs to SOFT DRINKS, we noticed that when customers buy BAG SNACKS, they will also buy SOFT DRINKS as shown below:
The top 10 rules contain BAG SNACKS.
We like to know when customers buy SOFT DRINKS what else they will buy or what other products customers buy will also buy SOFT DRINKS . By setting minimum support and confidence to 0.03 and 0.3 respectively and lhs to SOFT DRINKS we noticed that customers will also buy BAKED BREAD BUNS ROLLS or FLUID MILK PRODUCTS as shown below:
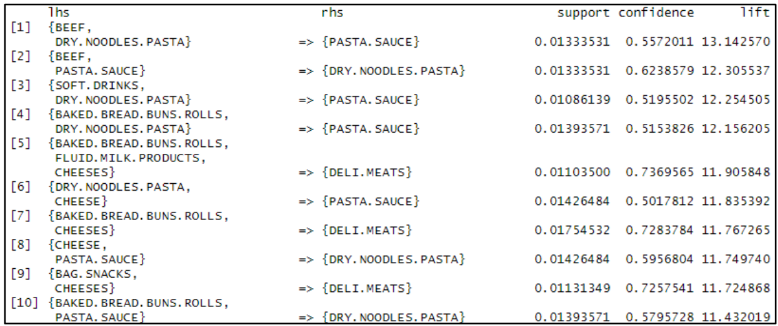
When all rules were sorted by lift in descending order, the consequents were either only PASTA.SAUCE, DRY.NOODLES.PASTA or DELI.MEATS as shown in the figure below:
This implies that customers who bought items from the antecedents increased the odds of them getting pasta sauce, dried pasta noodles or deli meats respectively. These rules have minimum confidence of 50% and high lift value of at least 11. Besides, it provides an insight showing the various food choices of households in the dataset. For example, some households serve pasta with beef, baked bread or cheese. Meanwhile, deli meats are likely to be taken together with baked bread, cheese or milk.
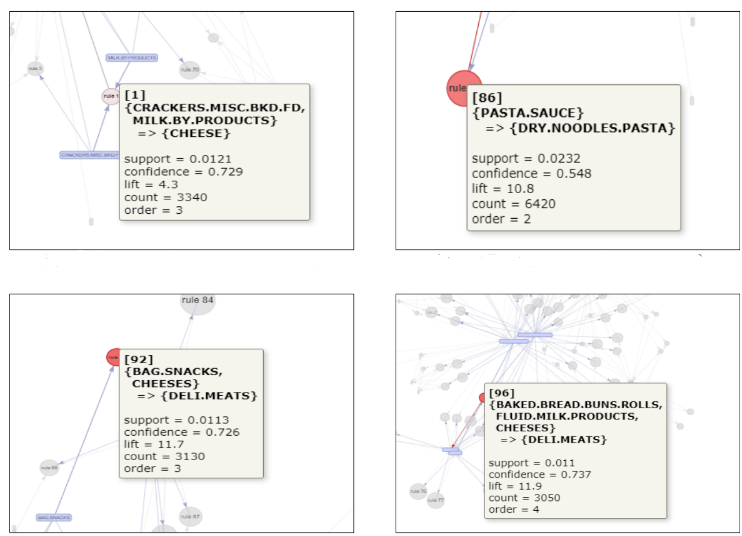
These generated association rules were further explored by plotting a network graph using R. The size of the node is directly proportional to the rule’s confidence, whereas the intensity of the node’s colour is directly proportional to the rule’s lift value. However,only the top 100 rules with the highest lift were shown due to limitations in R. Figure belows illustrate some interesting rules:
From the figure, we know that it is fairly certain that customers who bought crackers and milk by-products were likely to get cheese. Besides, shoppers who purchased pasta sauce bought dried pasta noodles as well.
operators should place these products at close range.
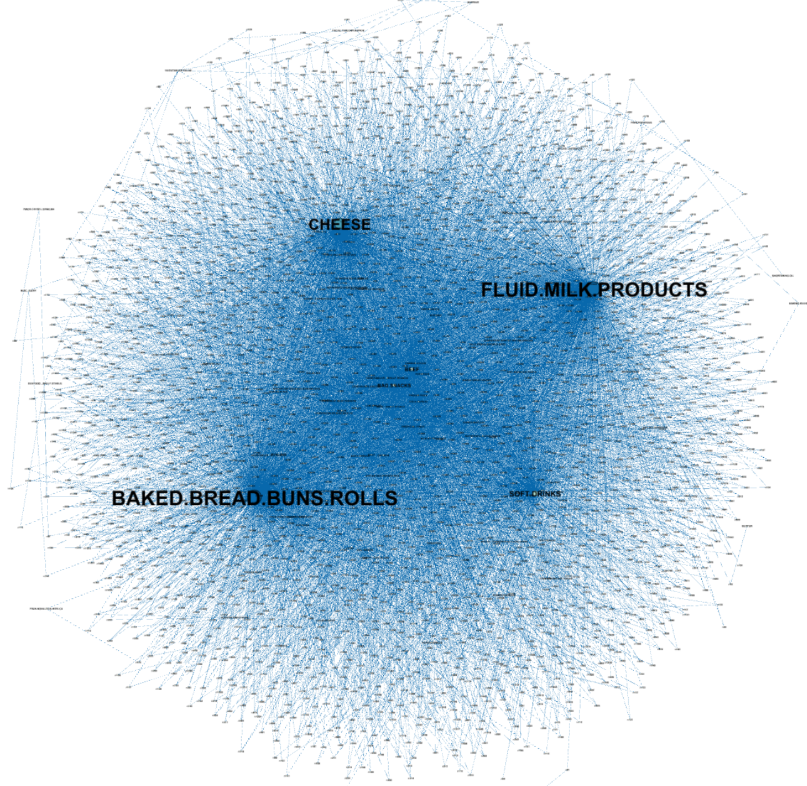
A force-directed graph was drawn with Fruchterman-Reingold layout to visualise association rules, using Gephi software as shown below. Items and rules were represented by nodes, whereas the relationship between them were depicted as edges.
BAKED.BREAD.BUNS.ROLLS appeared in most rules as consequent, followed by FLUID.MILK.PRODUCTS and CHEESE.
Meanwhile, the top 10 negative association rules with lift value less than 1 in descending order is shows as following:
CIGARETTES is the most common items appeared in either antecedent or consequent.
Insights Obtained from Market Basket Analysis
1) SOFT.DRINKS has the highest support followed by FLUID.MILK.PRODUCTS and BAKED.BREAD.BUNS.ROLL. They should be placed at different parts or at the back of the store to prompt sales of other products when customers walk all the way to them.
2) As CHEESE has a strong association with FLUID.MILK.PRODUCTS, it should be put alongside FLUID.MILK.PRODUCTS under the dairy products universe.
3) CEREALS can be placed close to FLUID.MILK.PRODUCTS as they are strongly associated.
4) BAG.SNACKS should be arranged next to SOFT.DRINKS as they are highly associated.
5) DELI MEATS can be placed beside the dairy product universe because it has strong associations with the FLUID.MILK.PRODUCTS and CHEESE.
6) DRY.NOODLES.PASTA and PASTA.SAUCE should be put together on the same shelf since whenever customers buy dried pasta noodles, they are more likely to buy pasta sauce.
7) BEEF has high association with PASTA.SAUCE and DRY.NOODLES.PASTA. As BEEF has a high value of support of 0.133, arranging PASTA.SAUCE and DRY.NOODLES.PASTA next to BEEF may prompt sales of both products.
8) CIGARETTES should be placed far from TROPICAL.FRUIT, FRUIT, VEGETABLES, APPLES and YOGURT.
9) DOMESTIC.WINE is negatively associated with CANDY and hence they should be put far away from each other. Furthermore, the candy section is likely to have kids around and wine is highly fragile products.

